How to Improve WordPress Design with Infographics
If the Internet is a thing, it is vision. People love the ease with which information can be accessed and absorbed. When text information is combined with visual content like charts, graphs, or photos, it could be even easier to understand complex data. We know that more and more admins create WordPress infographics and use them in their site headers, sidebar ads, footer designs, and article bodies.
It’s hard to deny that data visualizations in the form of infographics is essential for a successful WordPress blog content or marketing content.
Want to create WordPress infographics for website content? If yes, continue reading this article and we’ll teach you everything you need to know.
Content:
- What is an Infographic?
- Why use WordPress Infographic?
- When to use WordPress Infographic
- How to create WordPress infographics without design skills
- Conclusion
What is an infographic?
The word infographic is a coined word that combines information and graphic design. It is a visual representation of information using minimal characters and figures.
Infographics often consist of pictograms and diagrams. Photos may also be added to bring the content to life! Using these elements, massive data, graphs, and complex sentences can be represented with simple diagrams and illustrations.
Further, it is possible to convey the approximate content even if the language is different, especially when visuals are used effectively. And because infographics summarize information in a single diagram, they are convenient for spreading on SNS.
Attractive infographics have been shared on social media posts and have attracted a lot of attention.
Why use WordPress infographics?
There are various fields of application of infographics, such as charts and maps, route maps, materials, and manuals used for meetings presentation design, and visualization of scientific information. Nowadays, infographics are often used in advertising design.
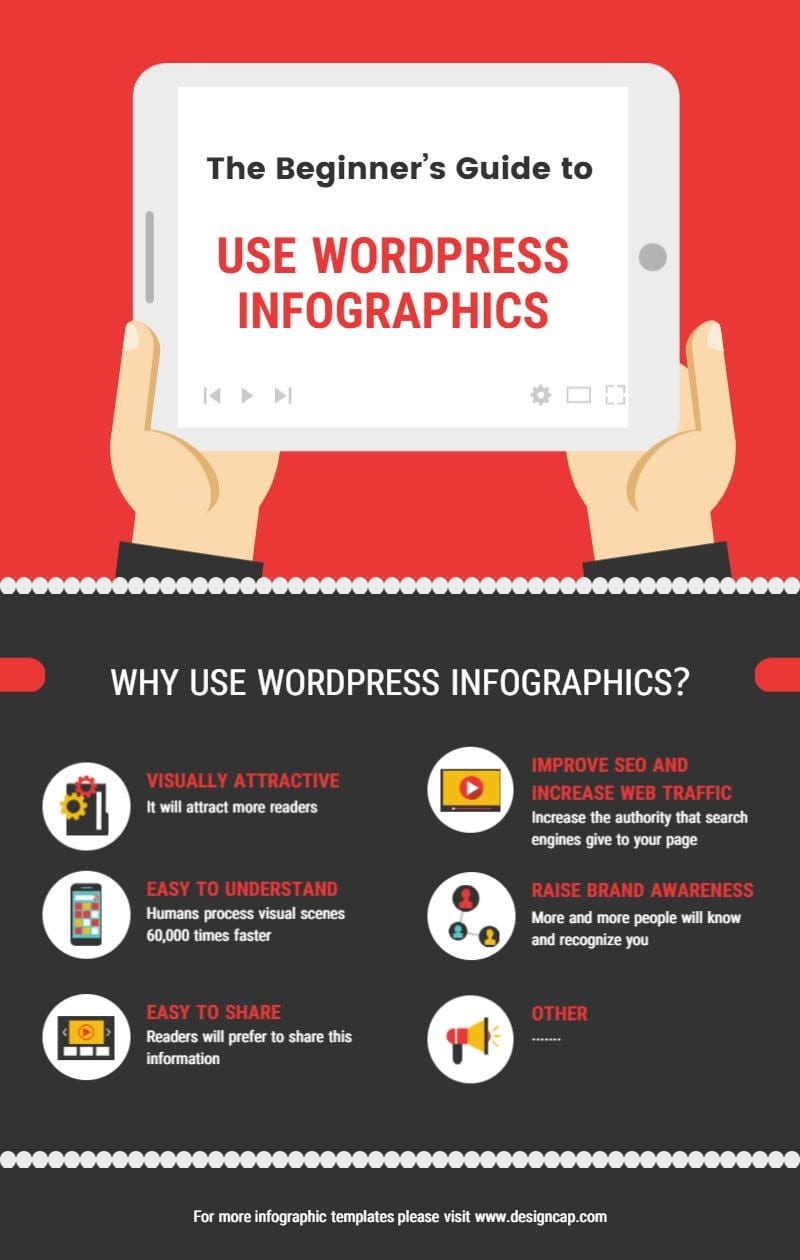
But why should you use infographics on your site? Here are five reasons that will convince you.
1. Infographics are Visually attractive
It allows you to highlight your posts and articles to your reader’s delight! When it comes to capturing your readers’ attention and making content digestion easy, infographics do a much better job than plain text. If you can get your infographics to offer quality information, you can get the readers to read the accompanying text and take action.
2. Easy to understand
The old saying that “an image is worth a thousand words” is not just a myth. Humans process visual scenes 60,000 times faster, and 40% respond better to illustrations. Accompanied by “photographic memory,” the content will be more natural to assimilate, remember, and understand.
Thus, you should use infographics design experience with images, colors, or icons. This favors the retention of the contents and the memory of your brand.
3. Easy to share
Without a doubt, it is one of the reasons why so many infographics are seen circulating on social networks and websites. If you create highly visual, attractive, and quality social media graphics, your readers will prefer to share this information with other users and this will give more visibility to your WordPress website.
4. Improve SEO and increase web traffic
Using infographics can not only create original content that is associated with your brand but can also increase your number of followers and subscribers.
As more people share the material linked to your website, your readers will increase, and so will the traffic to your WordPress site. Consequently, Google’s algorithm will place it in a higher position, which will increase the authority that search engines give to your page and improve SEO.
5. Raise brand awareness
One of the best features of infographics is that they put your brand out there. When you use your logo and brand color or theme in many infographics, and these get published on various websites and social media, more and more people will start to know and recognize you.
When to use WordPress infographics
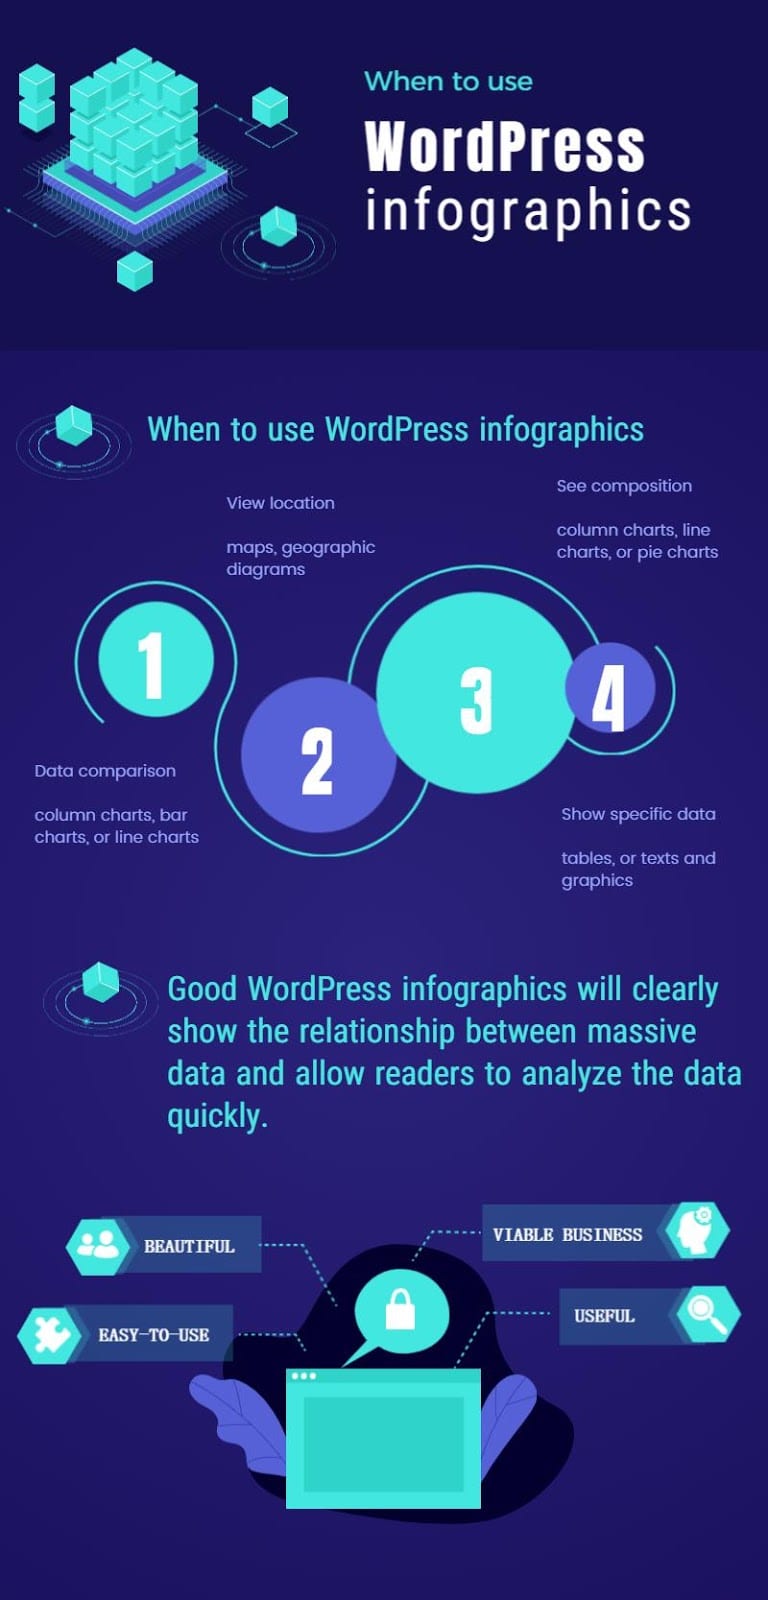
Good WordPress infographics will clearly show the relationship between complex data and allow readers to understand information quickly. If you are unsure when to use WordPress infographics, you can check the following ideas provided by DesignCap Infographic Maker, a super easy-to-use app for creating all types of infographics.
Data comparison
When you want to see the difference between values, such as the difference between categories, and how the value changes over time, use a comparison infographic.
For example, you can use it to see what product has the highest total sales this year? How has product sales increased or decreased in the past year? And you can use column charts, bar charts, or line charts in the infographic.
View location
Geographic maps allow you to visualize data by location. You can use geographic diagrams to show location-based data, such as which city has the highest service utilization rate. Or which countries have the most customers.
See composition
In case you want to explore the specific components of the total value, you can also use beautiful infographics to show them clearly. Infographics with column charts, line charts, or pie charts are great for this purpose.
With these informational infographics, you can display things like what percentage each region accounts for in the total sales. The distribution of the total quarterly budget for each department in the past year. And so much more.
Show Timeline
Timelines are important in various settings, whether you are explaining the history of a company, or illustrating a scientific process.
With timeline infographics, you can turn the usually plain explanation of time, into a vibrant, engaging experience for your readers.
These are just some common examples. There are numerous other situations in which we can use different infographics to show the content simply and visually.
Some great examples include process infographics for displaying an overview of the steps in a process; list infographics for making the points more eye-catching than a basic list; infographic visual resume for a great visual document to bring to an interview, etc.
How to create WordPress infographics without design skills?
Infographic design is a simple and attractive way to turn your ideas into stunning visuals. These illustrations can make your web page rich in media and significantly reduce the bounce rate and ultimately increase your Google ranking. But if you are not a pro designer, how can you create WordPress infographics for your content? Find an easy-to-use infographics maker.
There are many great drag-and-drop design tools in marketing like DesignCap, Canva, Venngage, Piktochart, Infogram, etc. Here we will focus on one specific tool for this tutorial – DesignCap. Let’s see how to create designs with this tool?
Step 1. Choose a WordPress infographics theme
DesignCap is a free tool with a huge database of free stock images and images icons. The tool allows you to design and download any image as PDF, PNG, or JPG. DesignCap even provides a pre-built infographic library, including presentation styles and data types.
Before starting your design creation, register an account. You can use email, Google, or Facebook accounts to register and login to DesignCap. After logging into the editor, select the size of the final image. You can choose a custom size or choose from one of the pre-built templates.
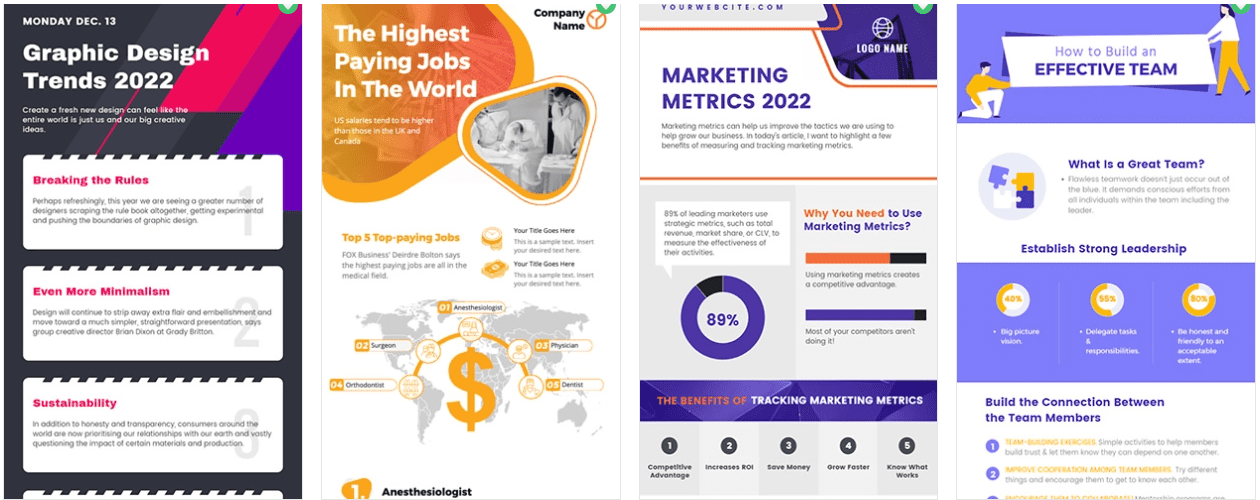
Each template has multiple options, depending on the type of data displayed, the visual effects used, and the specific niche used for the design. Browsing them, you may find a perfect template, no need to start from scratch.
Step 2. Add text and graphic elements
After selecting a suitable WordPress infographic template, it’s time to add text and change the font styles and colors fonts in the graph. Choose the preset desired text style and replace the default ones with your own. And then go ahead to customize your fonts.
DesignCap allows you to upload your fonts into the app and apply it to your text. While you can edit the text and fonts as you wish make sure you pay attention to the readability of the content.
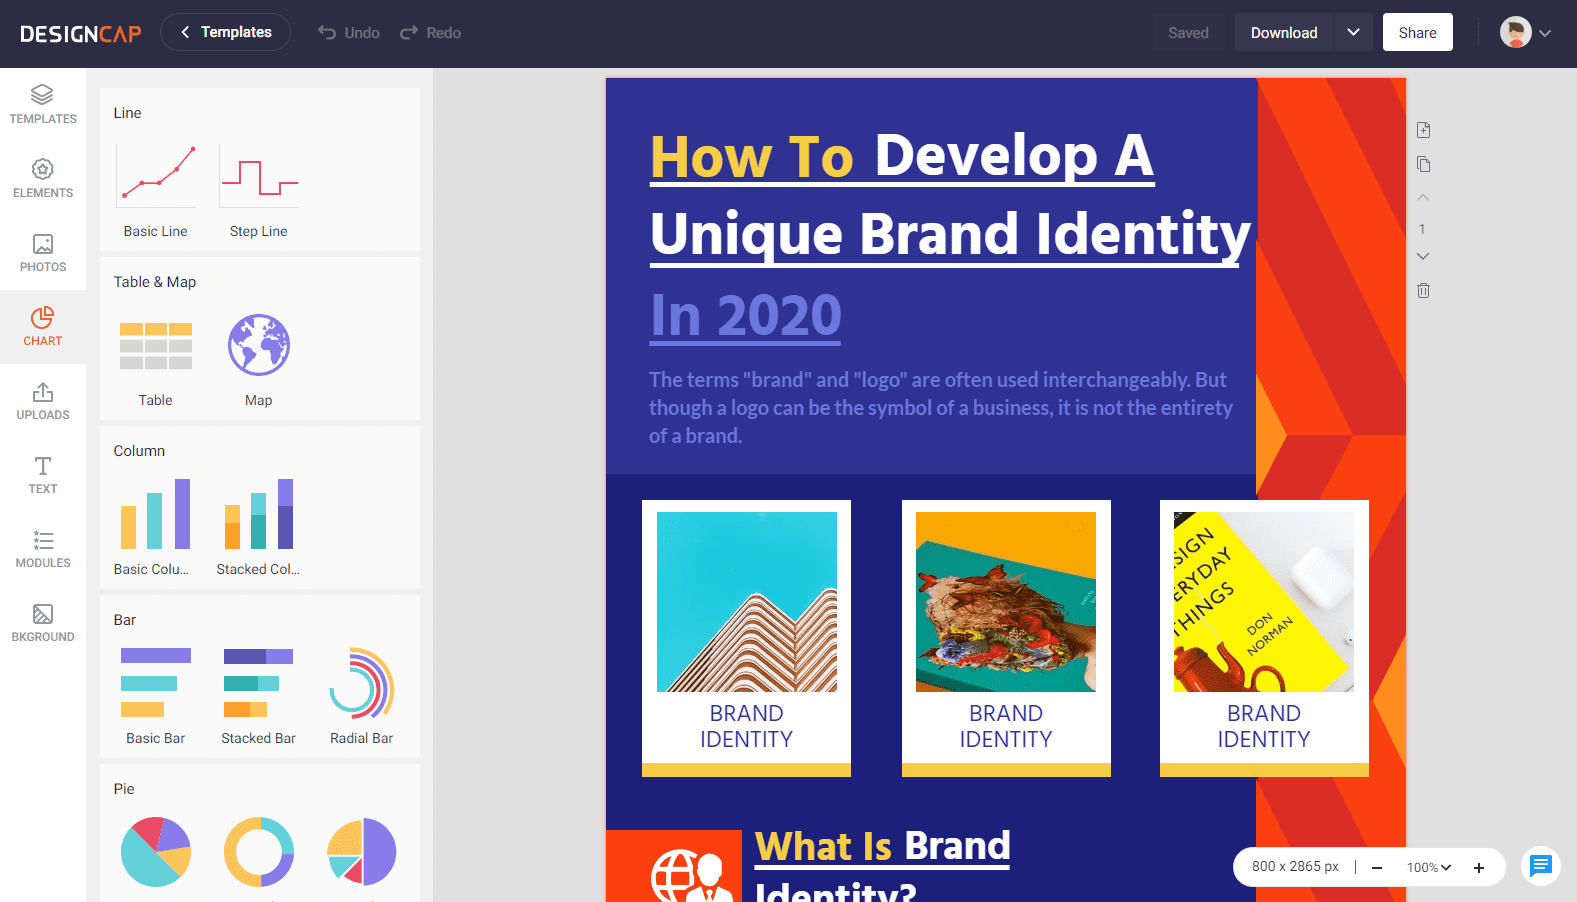
Besides text, DesignCap also makes it easy for you to add graphic elements to convey key data points. Go ahead and select the relevant image to represent your information. DesignCap contains visual elements like stock photos, shapes, icons, modules, charts, and graphs.
It allows you to add data from XLS, XLSX, or CSV files directly. You can upload your photo from a computer as well. For the map section, you can search a specific area with the country or region name. Then it will show you the map of this area.
When it comes to the background, you can choose from a library of different patterns, colors, and custom images. To change the background, click the background icon on the left screen. DesignCap offers three options to set your infographic background: color, preset patterns, and a custom image. If possible, choose a color that is consistent with your brand.
Step 3. Download the infographics
When the infographic design looks perfect, click the download button to display a list of file formats. Then choose one to save it. Adjacent to this button is the sharing option. DesignCap allows you to share your infographics directly to social media platforms or share it anywhere with the produced URL. Great, it’s time to make use of it on your WordPress website.
Tips for using the tool:
- It has an auto-save feature, no need to worry about losing data.
- Users can use this app anywhere. They can continue an unfinished project using cloud functionality.
- Simply adjust the spacing, line height of the text content for better display.
- Easily drag and drop a photo to some of its preset shapes, using them as photo frames.
- It has short-keys for some commonly used features such as Ctrl+C (copy), Ctrl+V (paste), Ctrl+X (delete),
- Ctrl+Z(undo), Ctrl+Y(redo).
How to Improve WordPress Design with Infographics -Conclusion
Infographics are visual representations of complex data in illustrations. Their goal is to simplify learning for users. Used well, they can summarize important information simply and visually.
Content marketing benefits from this simplicity! A well-done infographic can capture interest, and become viral – giving you excellent visibility among your readers.
Why don’t you try creating infographics using the steps covered in this article website content now.
More Resources:
- How to Add Dummy Text to WordPress Sites
- How to Fix ‘sorry you are not allowed to access this page’ Error in WordPress
- Why and How to Create a WordPress Wiki Page

